![]() Once again, this year The Journal of Blacks in Higher Education has completed its survey of admissions offices at the nation’s highest-ranked research universities. For the 27th consecutive year, we have calculated and compared the percentages of Black/African-American students in this fall’s entering classes. As in the past, our survey publishes information on the total number of Black applicants at the various institutions, their acceptance rates, enrollment numbers, and yield rates (the percentage of students who eventually enroll in the colleges at which they were accepted).
Once again, this year The Journal of Blacks in Higher Education has completed its survey of admissions offices at the nation’s highest-ranked research universities. For the 27th consecutive year, we have calculated and compared the percentages of Black/African-American students in this fall’s entering classes. As in the past, our survey publishes information on the total number of Black applicants at the various institutions, their acceptance rates, enrollment numbers, and yield rates (the percentage of students who eventually enroll in the colleges at which they were accepted).
Before we report this year’s results, it is important to note that a majority of high-ranking research universities are now unwilling to disclose information on Black student acceptance rates. After requesting data on Black student acceptance rates from 29 leading universities this year, we received data from only nine schools. When JBHE began collecting this data in the early 1990s, almost all of the leading research universities were willing to report Black student acceptance rates.
In our companion survey of Black first-year students at the nation’s leading liberal arts colleges, nearly all were willing to report Black student acceptance rates until very recently. This year seven schools declined to disclose the data. One high-ranking liberal arts college inadvertently sent us the data and then requested that we not report it.
The recent litigation involving the admissions practices of Harvard University concerning Asian American students appears to have struck a nerve in higher education circles. Colleges and universities increasingly seem to want to hold their cards close to their vests and not add fuel to efforts to challenge affirmative action admissions policies. They may also want to avoid having to defend their admissions policy in court at considerable expense.
Unquestionably, public and private litigation threats to affirmative action policies in college admissions have been a factor in producing this sensitivity. With this in mind, admissions officers — who, we believe, on the whole, are solidly supportive of affirmative action — have apprehensions when statistics on Black admissions are made available to the public. There are standard concerns too that racial conservatives on faculties and trustees may interpret the figures as suggesting a so-called dumbing down of academic standards and a favoring of “unqualified” Blacks over perhaps more qualified Whites. Probably, more importantly, these research universities may be unwilling to alienate conservative alumni and donors who come to believe that the university is giving what they believe to be unfair advantages to Blacks and members of other underrepresented groups.
JBHE does not believe there are sinister motives for this lack of disclosure. Generally, we believe that most major universities and high-ranking liberal arts colleges are dedicated to increasing diversity so that their student populations mirror the nation’s population. Indeed, the figures on Black student enrollments that have risen dramatically over the years tend to show this commitment.
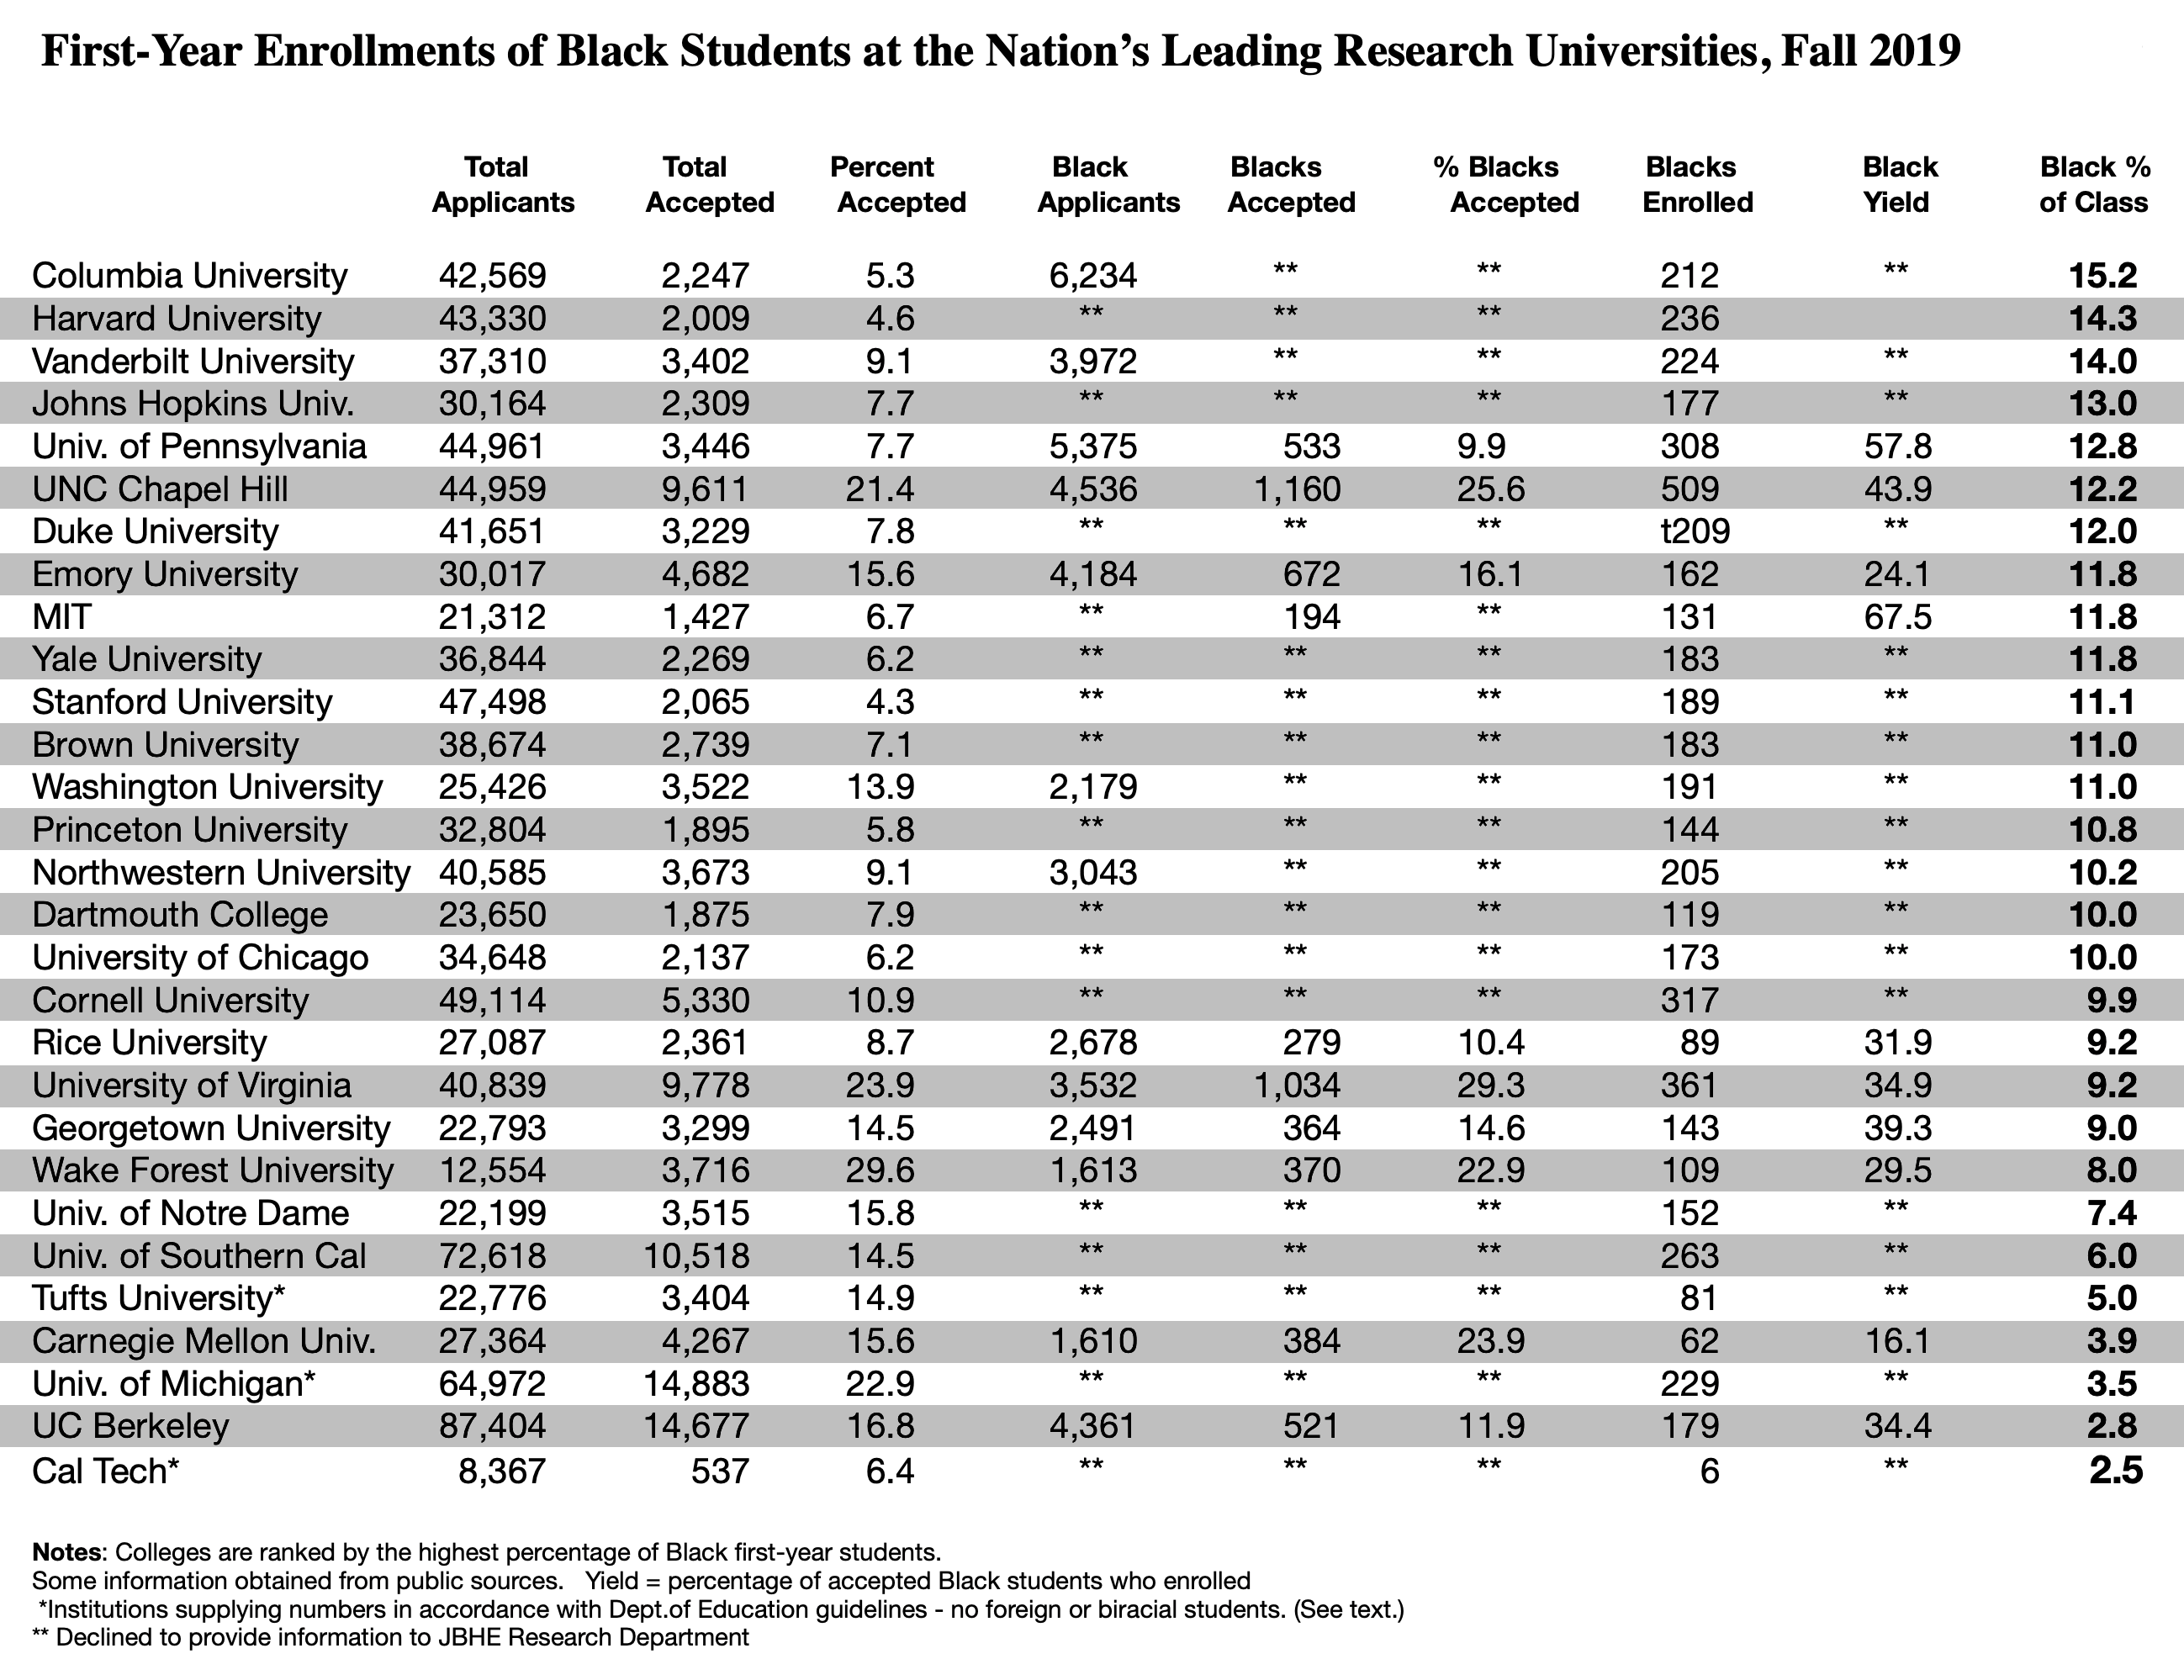
But as the reader can see in the accompanying chart there are large gaps in the data in the middle of the table where statistics on Black student acceptance rates are reported. The editors of the journal are now questioning whether it is useful to request such data in the future or merely report on the trends in Black student enrollments at these schools. Universities are required to make this data available to the public but they are allowed to shield the public on acceptance rates by racial and ethnic group. We would value readers’ input on this matter in our comments section.
Black Students in the Class of 2023
In 2004, Blacks made up only 6.8 percent of the entering students at Columbia University in New York City. Columbia ranked 15th among the high-ranking research universities in our survey that year. Just three years later in 2007, Columbia University headed the JBHE rankings for the first time with an entering class that was 11.4 percent Black. In 2010, there were 202 Black first-year students at Columbia. They made up 14.5 percent of the incoming students. At that time, this was the highest percentage of Black students in the entering class at a leading research university in the history of the JBHE survey. For nine years in a row, Columbia had the highest percentage of Black first-year students among the highest-ranking universities in the nation. Three years ago, Columbia finished in a virtual dead heat for first place but was narrowly edged out by Washington University for the top spot. Again in 2017, Columbia finished in second place with an entering class that was 13.9 percent Black.
In 2018, Columbia University once again sat atop the JBHE rankings. Blacks made up 15.5 percent of the 2018 entering class. This was the highest percentage of Black students in the entering class of a major research university in the 27 years of the JBHE survey.
And this year, Columbia retains the top spot. This year there are 212 Black students in the entering class. They make up 15.2 percent of the first-year students.

Harvard University has an entering class that is 14.3 percent Black, which places the university second overall and second in the Ivy League. Harvard held the second spot in last year’s rankings.
Two years ago, for the first time in the quarter-century history of our survey, Vanderbilt University in Nashville, Tennessee, had the highest percentage of Black students in its entering class of any of the high-ranking research universities in our survey. There were 226 Black first-year students at Vanderbilt, making up 14.1 percent of the entering class. This year, the Black percentage of the entering class is 14.0 percent. As a result, Vanderbilt is in third place in the overall rankings.
Johns Hopkins University in Baltimore reports that 13 percent of its entering class is Black. This is up from 11.1 percent a year ago. This put Johns Hopkins in fourth place in our rankings.
The University of Pennsylvania moved up to fifth place in our survey, after finishing in the sixth position a year ago. Blacks make up 12.8 percent of the entering class at Penn. The University of North Carolina at Chapel Hill and Duke University both have entering classes that are more than 12 percent Black. Six other high-ranking research universities have entering classes that are at least 11 percent Black. They are Emory University in Atlanta, the Massachusetts Institute of Technology, Yale University, Stanford University, Brown University and Washington University in St. Louis.
The history of Black first-year students at Washington University is particularly interesting. Five years ago, there were 84 Black students in the entering class at Washington University in St. Louis. They made up only 4.8 percent of the entering class. Only two high-ranking research universities had a lower percentage of Black students in their first-year classes. By 2015, there were 159 Black students in the entering class, making up 9.2 percent of all first-year students. Three years, there were 221 Black students in the entering class, making up 12.4 percent of all first-year students. This placed Washington University in first place overall. Last year, Washington University slipped to fourth place overall. This year, Washington University dropped to 13th place. However, Blacks still make up a very respectable 11 percent of the entering class, more than double the percentage from five years ago.
Another four high-ranked universities have entering classes that are at least 10 percent Black. They are Princeton University, Northwestern University, Dartmouth College, and the University of Chicago. In 2004, only two of the nation’s highest-ranked universities had incoming classes that were more than 10 percent Black. This year there are 17 high-ranked universities with an entering class that is more than 10 percent Black. This ties the all-time record that was set a year ago. This year there are six high-ranking universities that have an entering class that is at least 12 percent Black. In 2004, there were none. These figures are a major sign of progress for African Americans at our top universities.
The progress of the Ivy League schools over the past decade in admitting Black students has been impressive. In 2006, Columbia University had the highest percentage of Black first-year students at 9.6 percent. This year, seven of the eight Ivy League schools have entering classes that are 10 percent Black or higher. Cornell University just missed the threshold with an entering class that is 9.9 percent Black. In 2006, the lowest percentage of Blacks in an entering class was 5.9 percent. This year it is 9.9 percent. In 2006, there were 1,110 Black students in the entering classes at the eight Ivy League schools. In 2019, there are 1,702, a 53 percent increase.
There are only six African American students in the entering class at the California Institute of Technology. They make up 2.5 percent of the first-year class. The good news is that the number of Black students in the entering class at Caltech is up from four a year ago. The other two universities at the lower end of the rankings are public institutions in states that have laws prohibiting the consideration of race in college admissions. The University of California, Berkeley has an entering class that is 2.8 percent Black, down from 3.1 percent a year ago. The percentage of Black first-year students at Berkeley remains significantly below the level of Black enrollments that existed before that state enacted a ban on race-sensitive admissions.
The same is true at the University of Michigan. There, Blacks make up 3.5 percent of the students in the first-year class. This is down from 4.2 percent a year ago.
A Note on Methodology
Before we continue with the results, it is important to mention how the U.S. Department of Education collects data on the race of undergraduates. Before a change was made several years ago, students who reported more than one race (including African American) were included in the figures for Black students. This is no longer the case. Thus, students who self-identify as biracial or multiracial with some level of African heritage are no longer classified as Black by the Department of Education.
JBHE surveys have always asked respondents to include all students who self-identify as having African American or African heritage including those who are actually from Africa. JBHE has always maintained that biracial, multiracial, and Black students from Africa add to the diversity of a college campus. And including these students in our figures offers college-bound Black students a better idea of what they can expect at a given college or university. In order that we can compare our current data to past JBHE surveys, we have continued to ask colleges and universities to include all students who identify themselves as having African American or African heritage.
Caution: Some universities that participate in our survey choose to adhere to Department of Education guidelines and report figures for African American students only and do not include African, biracial, or multiracial students in the figures reported to JBHE. These institutions are indicated by an asterisk in the accompanying table. Undoubtedly, the percentage of Black students at these research universities would be higher – sometimes significantly so – if they included African, biracial, and multiracial students.
Gainers and Losers
We have data on first-year enrollments of Black students at 29 high-ranking research universities for both 2018 and 2019. Fifteen showed gains over the previous year in Black student first-year enrollments. Fourteen high-ranking universities showed declines in their number of entering students who are Black. It must be noted that gains or declines in the number of first-year Black students at some universities may be due to overall increases or decreases in the size of the first-year class and not necessarily due to a higher or lower percentage of Black first-year students. Also, some universities showing major drops in the number of Black students may now only be reporting figures corresponding with U.S. Department of Education guidelines, whereas in the past, numbers may have included foreign Black and biracial students. Those showing major increases may be due to the inclusion of all students who identify as Black, whereas in the past the college may have only reported numbers corresponding to federal government classifications.
One-Year Gainers and Losers in Black First-Year Enrollments at High-Ranking Research Universities
| School | 2018 | 2019 | % Change |
|---|---|---|---|
| Cal Tech | 4 | 6 | +50.0 |
| Princeton University | 112 | 144 | +28.6 |
| Dartmouth College | 96 | 119 | +24.0 |
| Johns Hopkins University | 146 | 177 | +21.2 |
| MIT | 111 | 131 | +18.0 |
| University of Notre Dame | 131 | 152 | +16.1 |
| Duke University | 181 | 209 | +15.5 |
| Tufts University | 73 | 81 | +11.0 |
| Stanford University | 172 | 189 | +9.9 |
| University of Pennsylvania | 295 | 308 | +5.1 |
| Northwestern University | 196 | 205 | +4.6 |
| Emory University | 155 | 162 | +4.5 |
| University of Chicago | 167 | 173 | +4.0 |
| UNC Chapel Hill | 495 | 509 | +2.8 |
| University of Virginia | 357 | 361 | +0.1 |
| Yale University | 186 | 183 | -0.2 |
| Brown University | 187 | 189 | -1.1 |
| Harvard University | 240 | 236 | -1.7 |
| Vanderbilt University | 229 | 224 | -2.2 |
| Columbia University | 221 | 212 | -4.1 |
| Wake Forest University | 115 | 109 | -5.2 |
| UC Berkeley | 193 | 179 | -7.3 |
| Univ. of Southern California | 291 | 263 | -9.6 |
| Washington University | 217 | 191 | -12.0 |
| Cornell University | 363 | 317 | -12.7 |
| University of Michigan | 266 | 229 | -13.9 |
| Rice University | 104 | 89 | -14.4 |
| Georgetown University | 185 | 143 | -22.7 |
| Carnegie Mellon University | 82 | 62 | -24.4 |
Source: JBHE Research Department
Black Student Acceptance Rates
As stated above, for the 29 highest-ranked universities for which we have data on Black students in their entering classes, we have Black acceptance rate statistics for only nine universities.
At seven of the nine universities that supplied acceptance rate data to JBHE, the Black student acceptance rate was higher than the acceptance rate for all students. In the past the differences in acceptance rates at some universities were quite large. But now, the differences are usually very narrow. Again, this may reflect a concern over the threat of litigation if there is a perception that a particular racial or ethnic group is receiving an edge in the admissions process.
We also collect data on the number of Black students who were accepted at a particular university, who decide to enroll. This is called student yield. But because universities are reluctant to report on the number of Black applicants and the number of Black students who are accepted, student yield numbers by race and ethnic group are difficult to obtain. Of the 10 universities that reported Black student yield, the highest rate was at the Massachusetts Institute of Technology. At MIT, 67.5 percent of all Black students accepted for admission decided to enroll. Among the reporting universities, the University of Pennsylvania ranked second in Black student yield with a rate of 57.8 percent. The lowest reported Black student yield was at Carnegie Mellon University in Pittsburgh. Traditionally Harvard University and Stanford University have had the highest Black student yields. But in recent years, Black student yield at these high-ranking institutions has not been made available to JBHE.


It would be interesting to know the Black student yield at the various universities if Black athletes were separated from the main sample. Certainly, many of the athletes could gain admission based on traditional measurements but all athletes often have lesser academic requirements than the rest of the applicants/enrollees. Thus, Black athletes could skew the yield number but in doing so give an inaccurate picture of the systemic efforts a particular university is making to diversify its student body. Same goes for legacies.